Topic-Coverage Heatmap
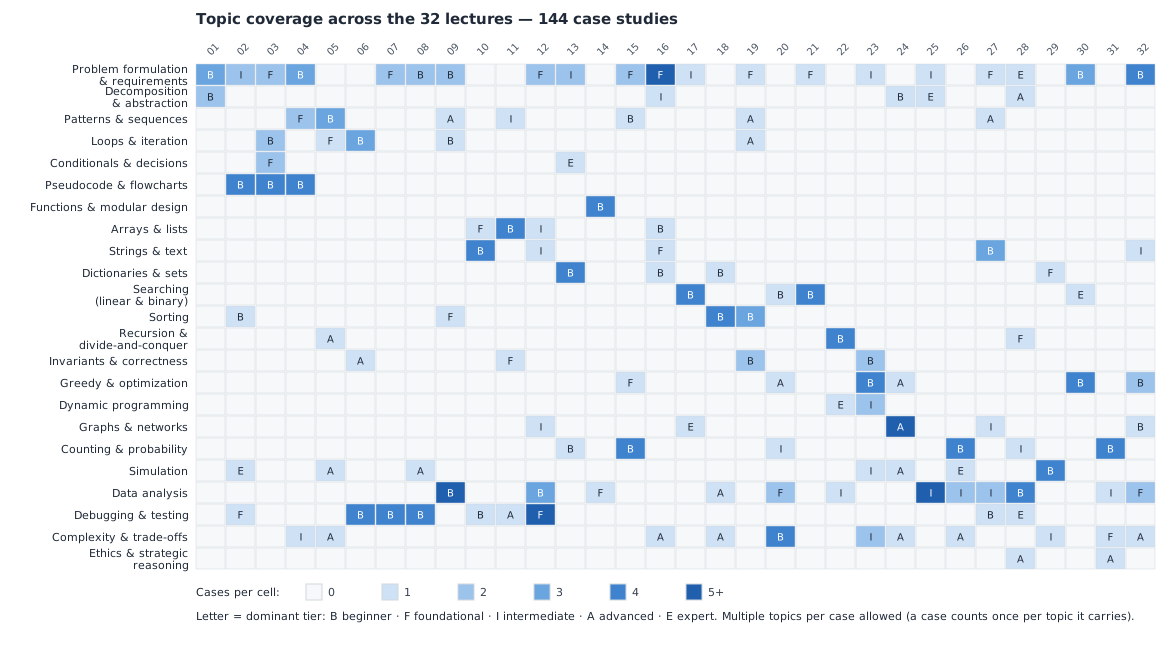
Scope: all 144 case studies (Beginner 33, Foundational 37, Intermediate 38, Advanced 23, Expert 13). Generated by scripts/gen_topic_heatmap.py from case metadata — regenerate after any case change; do not hand-edit. Companion files: CSV matrix, SVG heatmap.
Taxonomy source
The canonical topics are the course's own vocabulary, drawn from docs/learning-outcomes.md and docs/course-outline.md (the curriculum threads every lecture already teaches), not invented for this report. Each case's free-form topic tags (the full raw-tag inventory) are mapped to exactly one canonical topic by the alias table in the generator; an unmapped tag fails the build rather than vanishing from the count.
Counting methodology
- Multiple topics per case are allowed. A case counts once per canonical topic it carries (set semantics on its tags), so column sums exceed the case count — that is coverage, not duplication.
- Difficulty distribution is the exact tier vector of the cases in each cell (CSV columns
beginner…expert; the SVG cell letter is the dominant tier). Tier totals come from case metadata itself. - Primary vs secondary topics are not distinguished: case metadata does not rank its tags, and inventing a ranking would fabricate data. The limitation is stated rather than hidden.
Coverage matrix (SVG preview is the authoritative rendering)
| Topic | Lectures touched | Cases | Tier mix (B/F/I/A/E) |
|---|---|---|---|
| Problem formulation & requirements | 20 | 41 | 7/14/14/3/3 |
| Decomposition & abstraction | 5 | 6 | 2/1/1/1/1 |
| Patterns & sequences | 7 | 10 | 2/2/2/4/0 |
| Loops & iteration | 5 | 8 | 3/2/2/1/0 |
| Conditionals & decisions | 2 | 3 | 0/1/0/1/1 |
| Pseudocode & flowcharts | 3 | 12 | 3/3/3/2/1 |
| Functions & modular design | 1 | 4 | 1/1/1/0/1 |
| Arrays & lists | 4 | 7 | 2/2/2/1/0 |
| Strings & text | 5 | 10 | 2/3/4/1/0 |
| Dictionaries & sets | 4 | 7 | 3/2/1/0/1 |
| Searching (linear & binary) | 4 | 10 | 3/2/2/0/3 |
| Sorting | 4 | 9 | 3/3/1/1/1 |
| Recursion & divide-and-conquer | 3 | 6 | 1/2/1/1/1 |
| Invariants & correctness | 4 | 6 | 2/2/1/1/0 |
| Greedy & optimization | 6 | 13 | 3/4/2/3/1 |
| Dynamic programming | 2 | 3 | 0/0/1/1/1 |
| Graphs & networks | 5 | 9 | 2/1/3/2/1 |
| Counting & probability | 6 | 15 | 4/3/5/2/1 |
| Simulation | 7 | 10 | 1/1/2/3/3 |
| Data analysis | 12 | 29 | 5/7/10/5/2 |
| Debugging & testing | 9 | 22 | 6/6/4/5/1 |
| Complexity & trade-offs | 11 | 15 | 1/2/5/7/0 |
| Ethics & strategic reasoning | 2 | 2 | 0/0/0/2/0 |
Coverage gaps (topic in ≤ 5 lectures)
- Functions & modular design — 1 lecture(s), 4 case(s) in total.
- Conditionals & decisions — 2 lecture(s), 3 case(s) in total.
- Dynamic programming — 2 lecture(s), 3 case(s) in total.
- Ethics & strategic reasoning — 2 lecture(s), 2 case(s) in total.
- Pseudocode & flowcharts — 3 lecture(s), 12 case(s) in total.
- Recursion & divide-and-conquer — 3 lecture(s), 6 case(s) in total.
- Arrays & lists — 4 lecture(s), 7 case(s) in total.
- Dictionaries & sets — 4 lecture(s), 7 case(s) in total.
- Searching (linear & binary) — 4 lecture(s), 10 case(s) in total.
- Sorting — 4 lecture(s), 9 case(s) in total.
- Invariants & correctness — 4 lecture(s), 6 case(s) in total.
- Decomposition & abstraction — 5 lecture(s), 6 case(s) in total.
- Loops & iteration — 5 lecture(s), 8 case(s) in total.
- Strings & text — 5 lecture(s), 10 case(s) in total.
- Graphs & networks — 5 lecture(s), 9 case(s) in total.
Concentrations (cells with ≥ 3 cases in one lecture)
- Data analysis in lecture 09: 5 cases.
- Data analysis in lecture 25: 5 cases.
- Debugging & testing in lecture 12: 5 cases.
- Graphs & networks in lecture 24: 5 cases.
- Problem formulation & requirements in lecture 16: 5 cases.
- Arrays & lists in lecture 11: 4 cases.
- Complexity & trade-offs in lecture 20: 4 cases.
- Counting & probability in lecture 15: 4 cases.
- Counting & probability in lecture 26: 4 cases.
- Counting & probability in lecture 31: 4 cases.
- Data analysis in lecture 28: 4 cases.
- Debugging & testing in lecture 06: 4 cases.
- Debugging & testing in lecture 07: 4 cases.
- Debugging & testing in lecture 08: 4 cases.
- Dictionaries & sets in lecture 13: 4 cases.
- Functions & modular design in lecture 14: 4 cases.
- Greedy & optimization in lecture 23: 4 cases.
- Greedy & optimization in lecture 30: 4 cases.
- Problem formulation & requirements in lecture 32: 4 cases.
- Pseudocode & flowcharts in lecture 02: 4 cases.
- Pseudocode & flowcharts in lecture 03: 4 cases.
- Pseudocode & flowcharts in lecture 04: 4 cases.
- Recursion & divide-and-conquer in lecture 22: 4 cases.
- Searching (linear & binary) in lecture 17: 4 cases.
- Searching (linear & binary) in lecture 21: 4 cases.
- Simulation in lecture 29: 4 cases.
- Sorting in lecture 18: 4 cases.
- Strings & text in lecture 10: 4 cases.
- Data analysis in lecture 12: 3 cases.
- Loops & iteration in lecture 06: 3 cases.
- Patterns & sequences in lecture 05: 3 cases.
- Problem formulation & requirements in lecture 01: 3 cases.
- Problem formulation & requirements in lecture 04: 3 cases.
- Problem formulation & requirements in lecture 30: 3 cases.
- Sorting in lecture 19: 3 cases.
- Strings & text in lecture 27: 3 cases.
Overrepresented topics (most cases overall)
- Problem formulation & requirements — 41 cases across 20 lectures.
- Data analysis — 29 cases across 12 lectures.
- Debugging & testing — 22 cases across 9 lectures.
- Counting & probability — 15 cases across 6 lectures.
- Complexity & trade-offs — 15 cases across 11 lectures.
Known limitations
- Tags reflect author intent at case-writing time; the alias mapping is a judgement call per tag (each documented in the generator).
- Lecture cells count the cases assigned to that lecture, so a topic taught as a thread across blocks (e.g. complexity) looks more scattered than the teaching feels.
- The SVG letter shows only the dominant tier of a cell; the full tier vector per cell is in the CSV (columns after the lecture columns, encoded as
count; b/f/i/a/e).
Lecture case counts span 4–6 per lecture (every lecture has cases — the validator enforces it).